by Saumil Shah @therealsaumil
November 2019
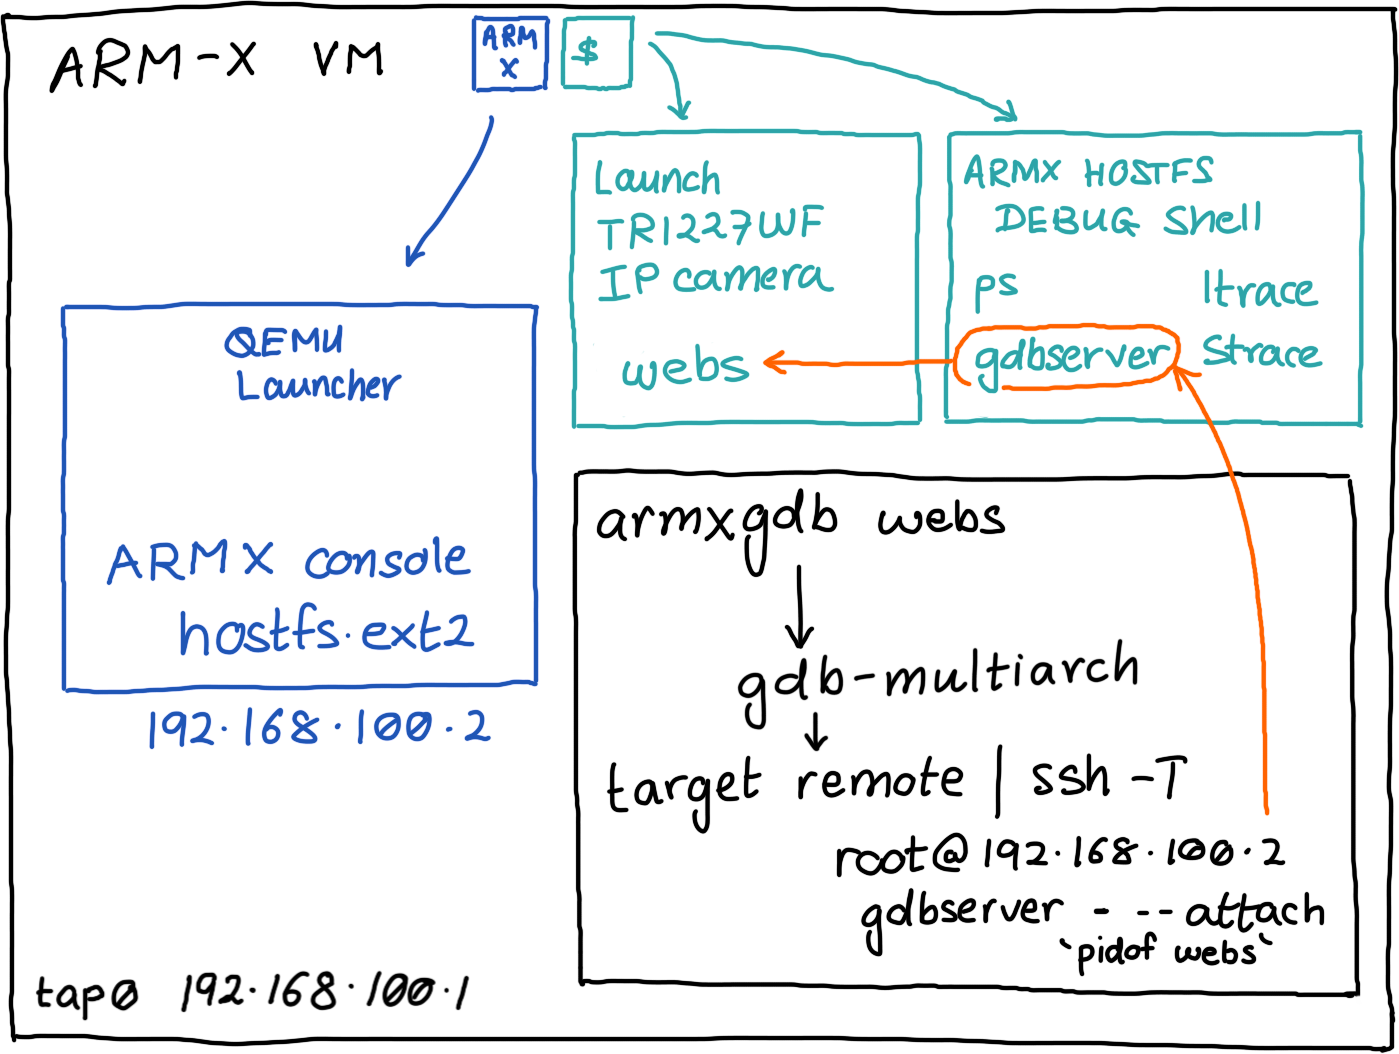
The ARM-X November 2019 VM contains updated tools and scripts to make debugging emulated IoT processes easy. No more fiddling around with gdbserver and GDB's target remote, set sysroot commands! One command to debug them all.

The ARM-X Firmware Emulation Framework contains essential tools and utilities to statically and dynamically analyse emulated IoT targets. Here, we shall see how to use gdb to debug a process running on an emulated IoT target. We shall use the ARM-X November 2019 VM and debug the web server running on the Trivision NC-227-WF IP Camera as an example.
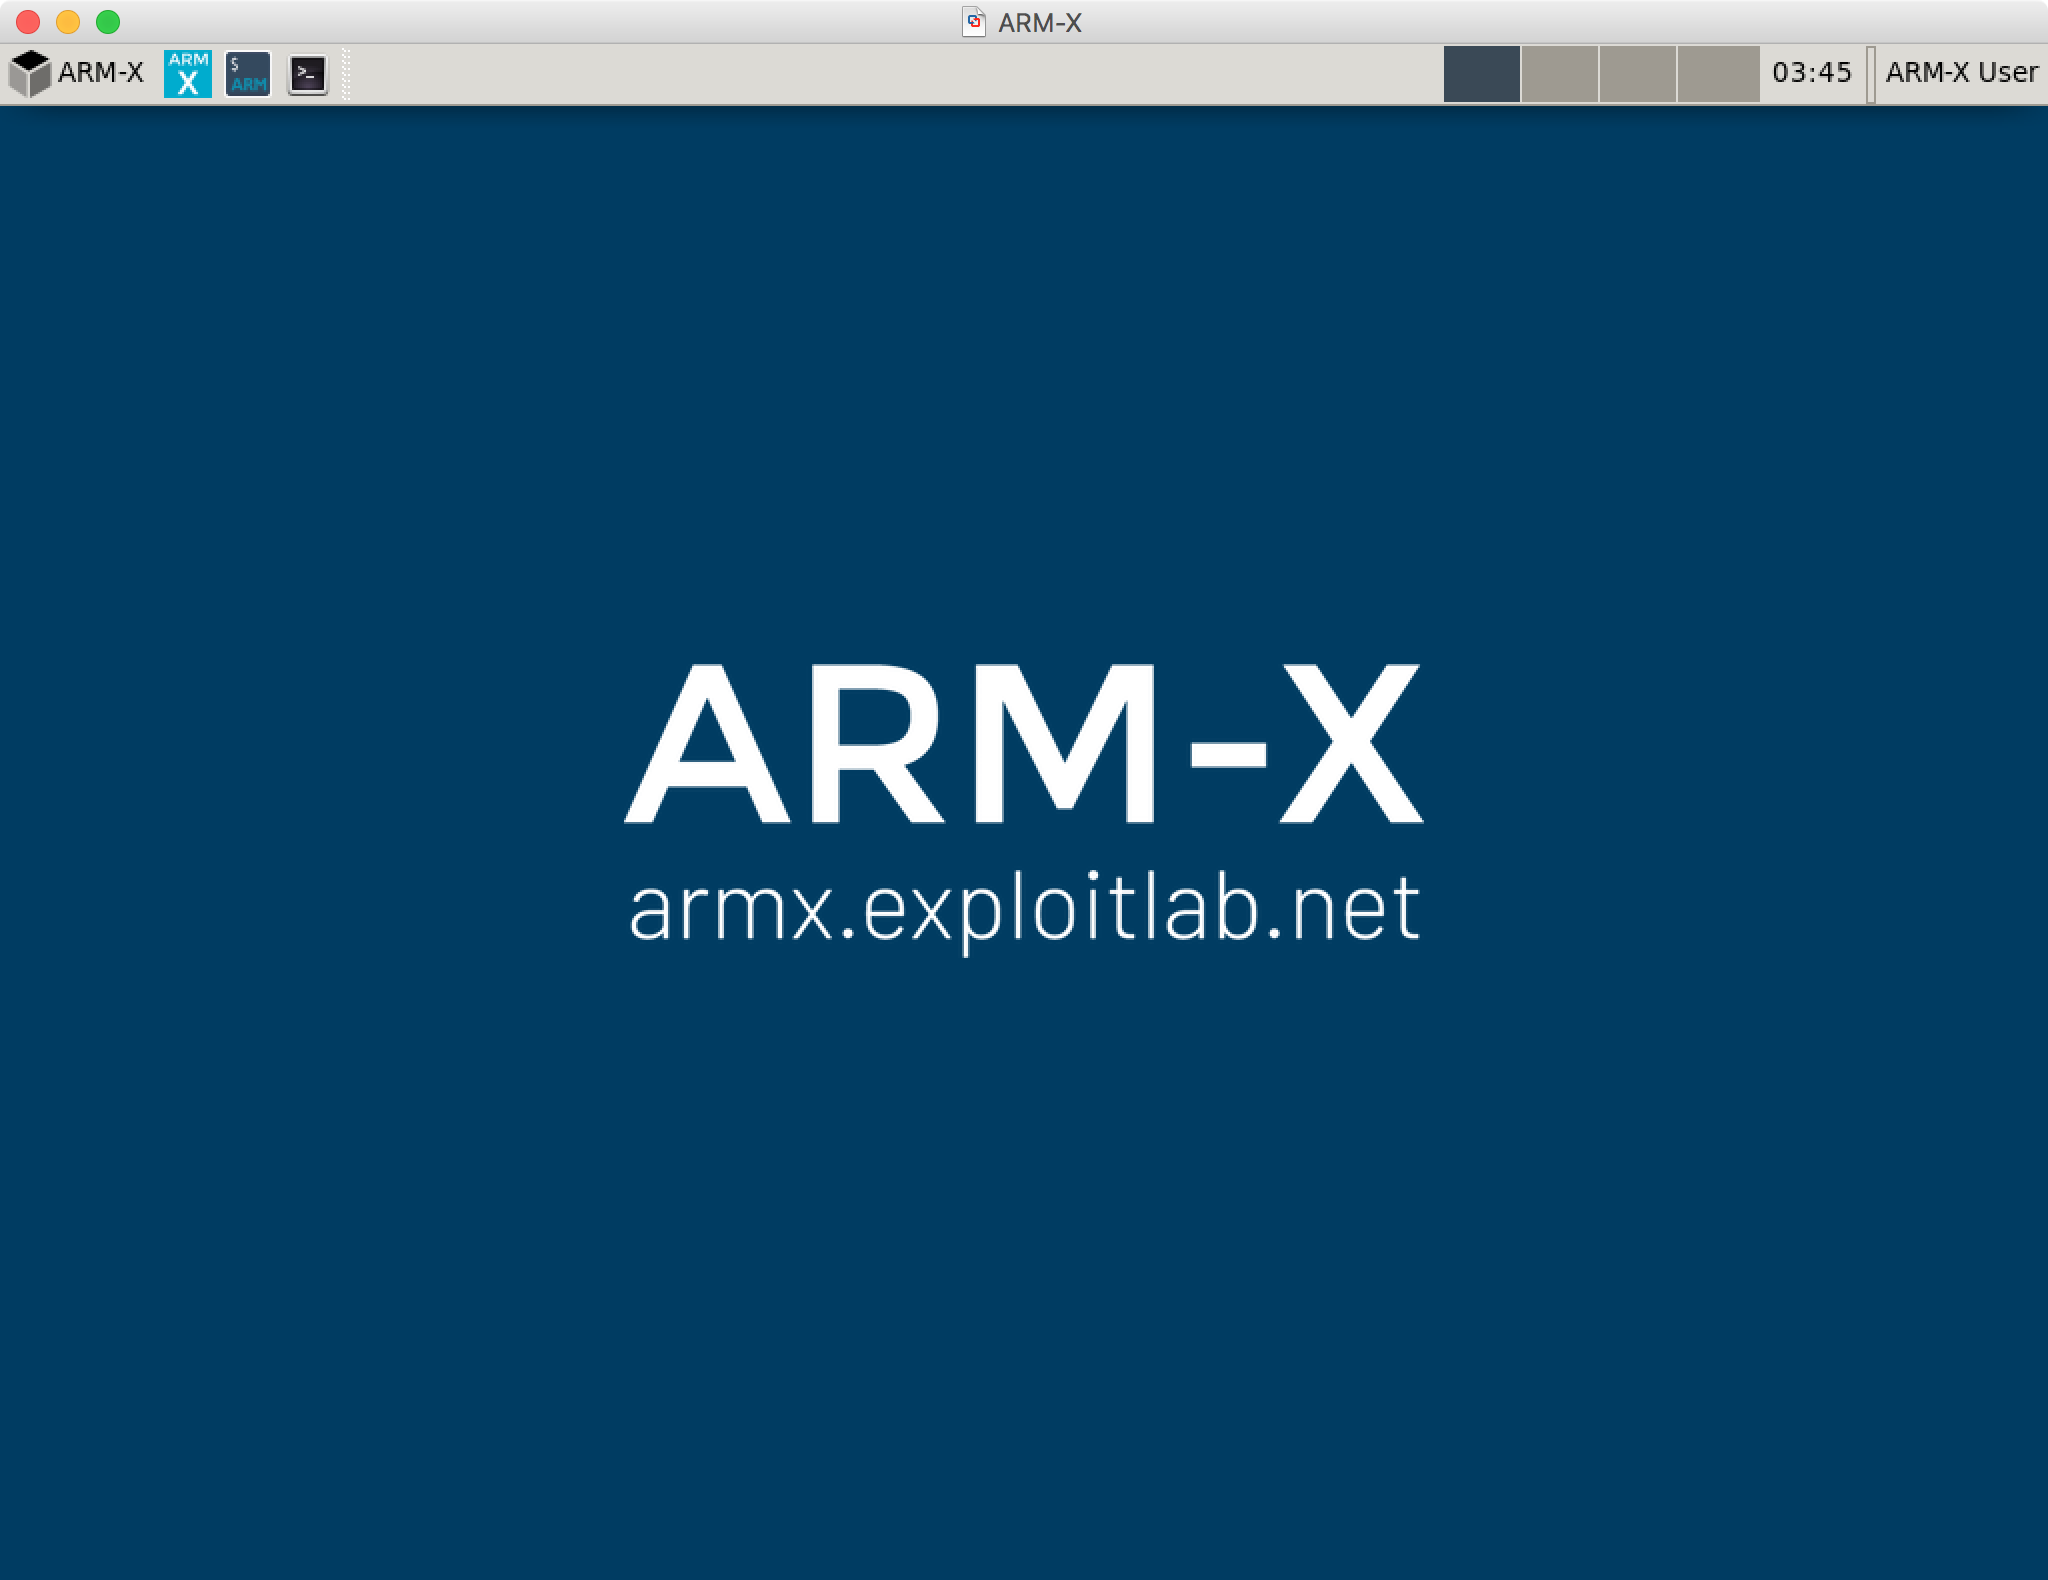
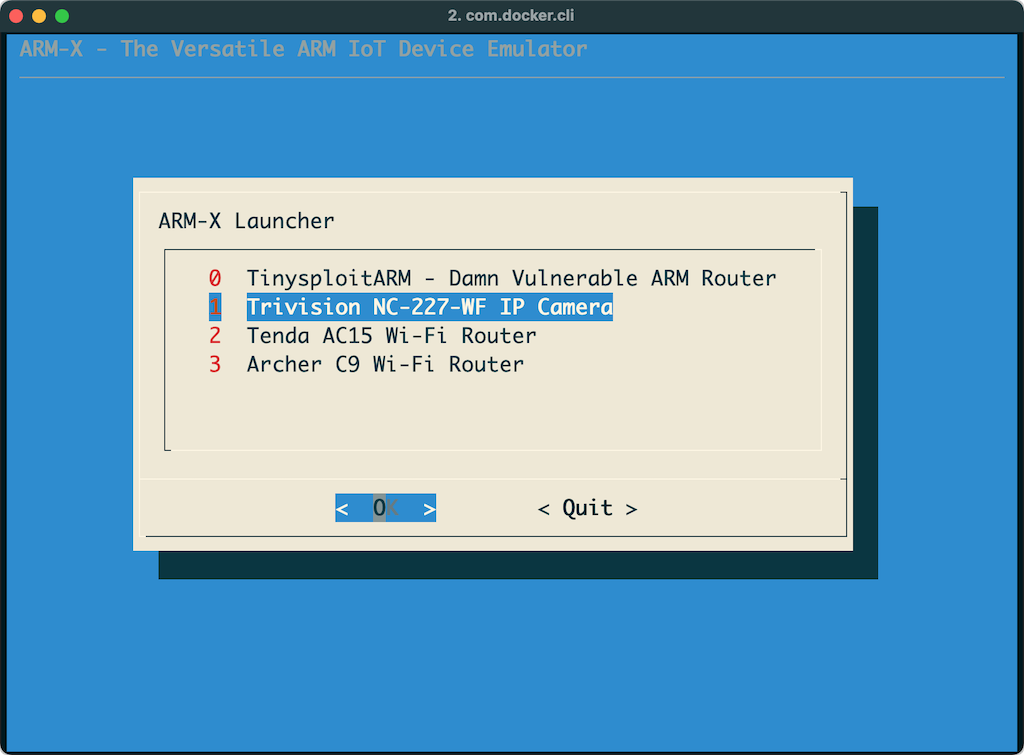
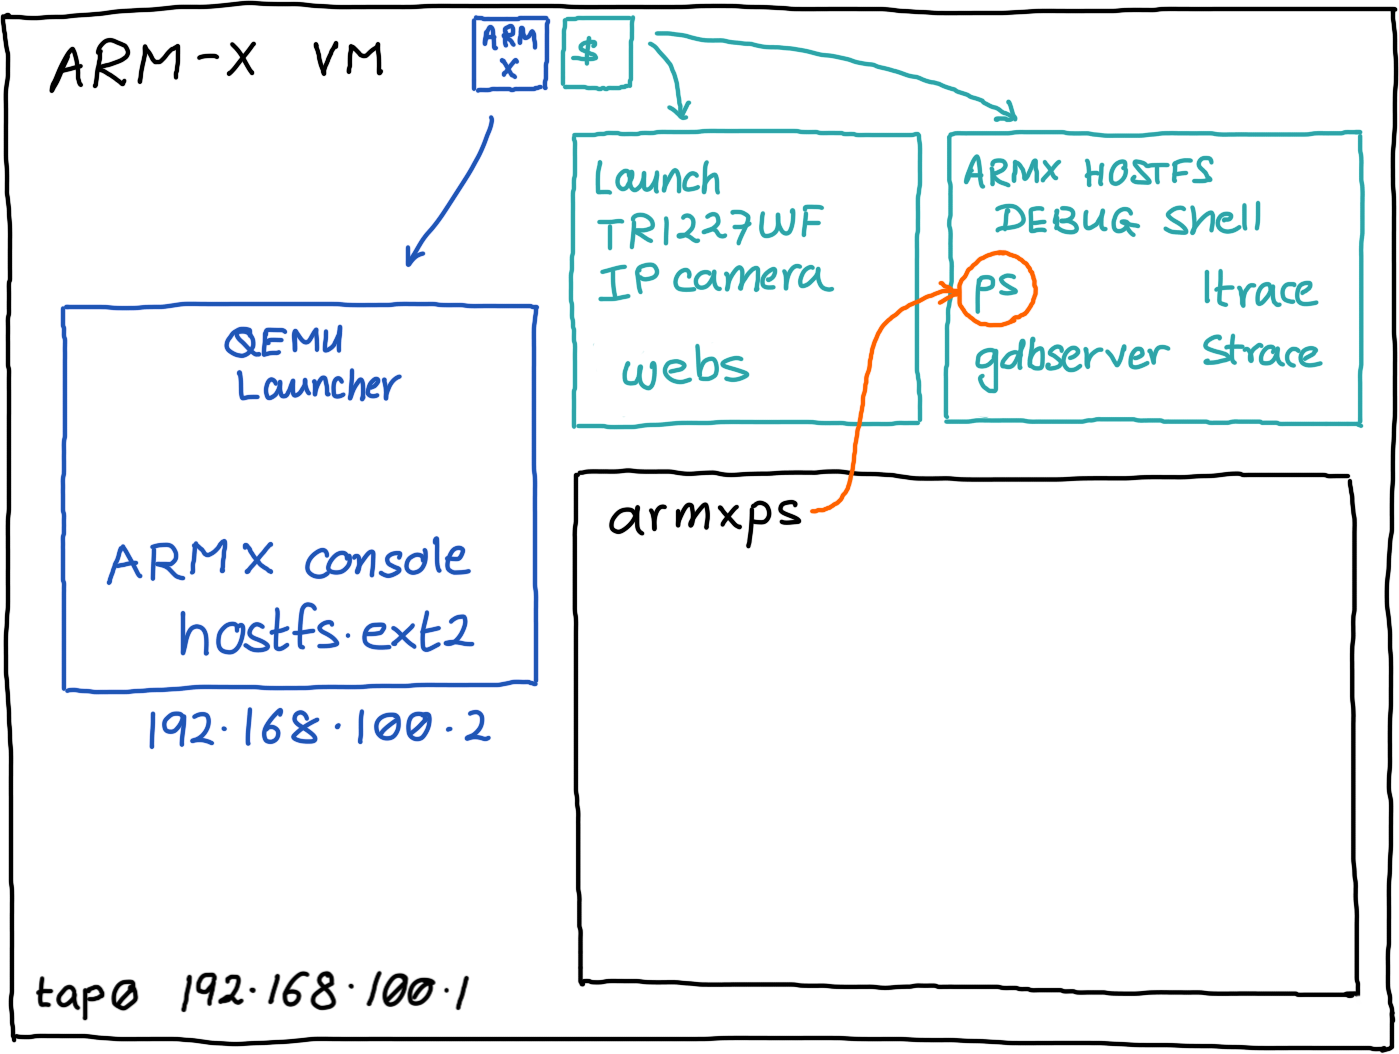
Click the ARM-X Launcher icon on the top toolbar and select the Trivision NC-227-WF IP Camera:
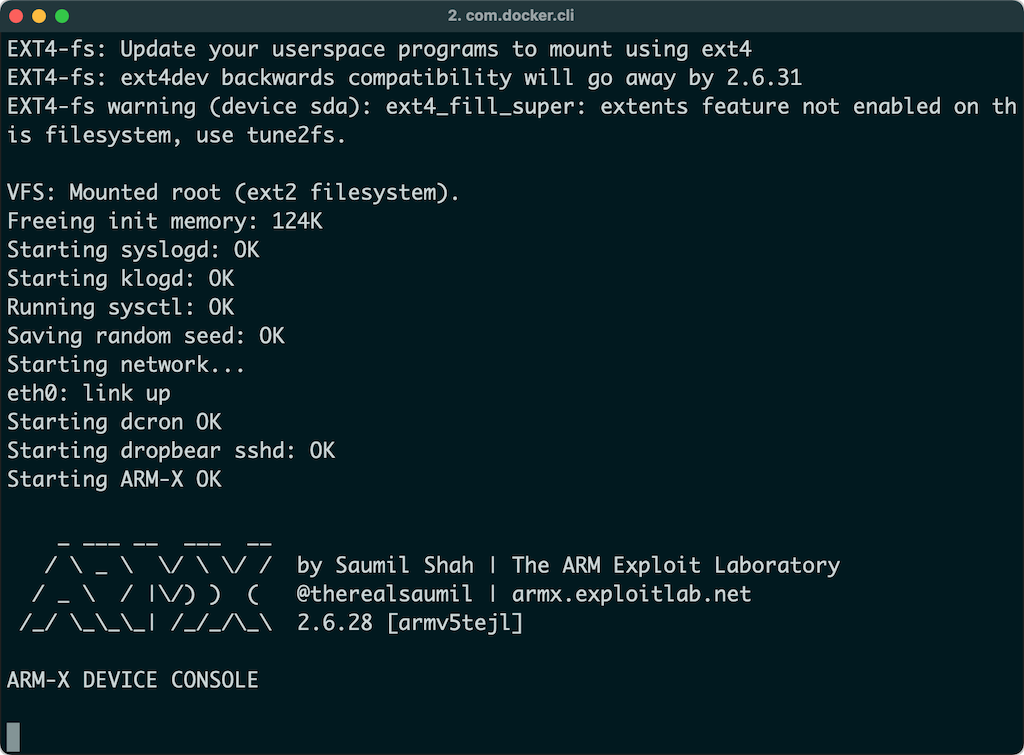
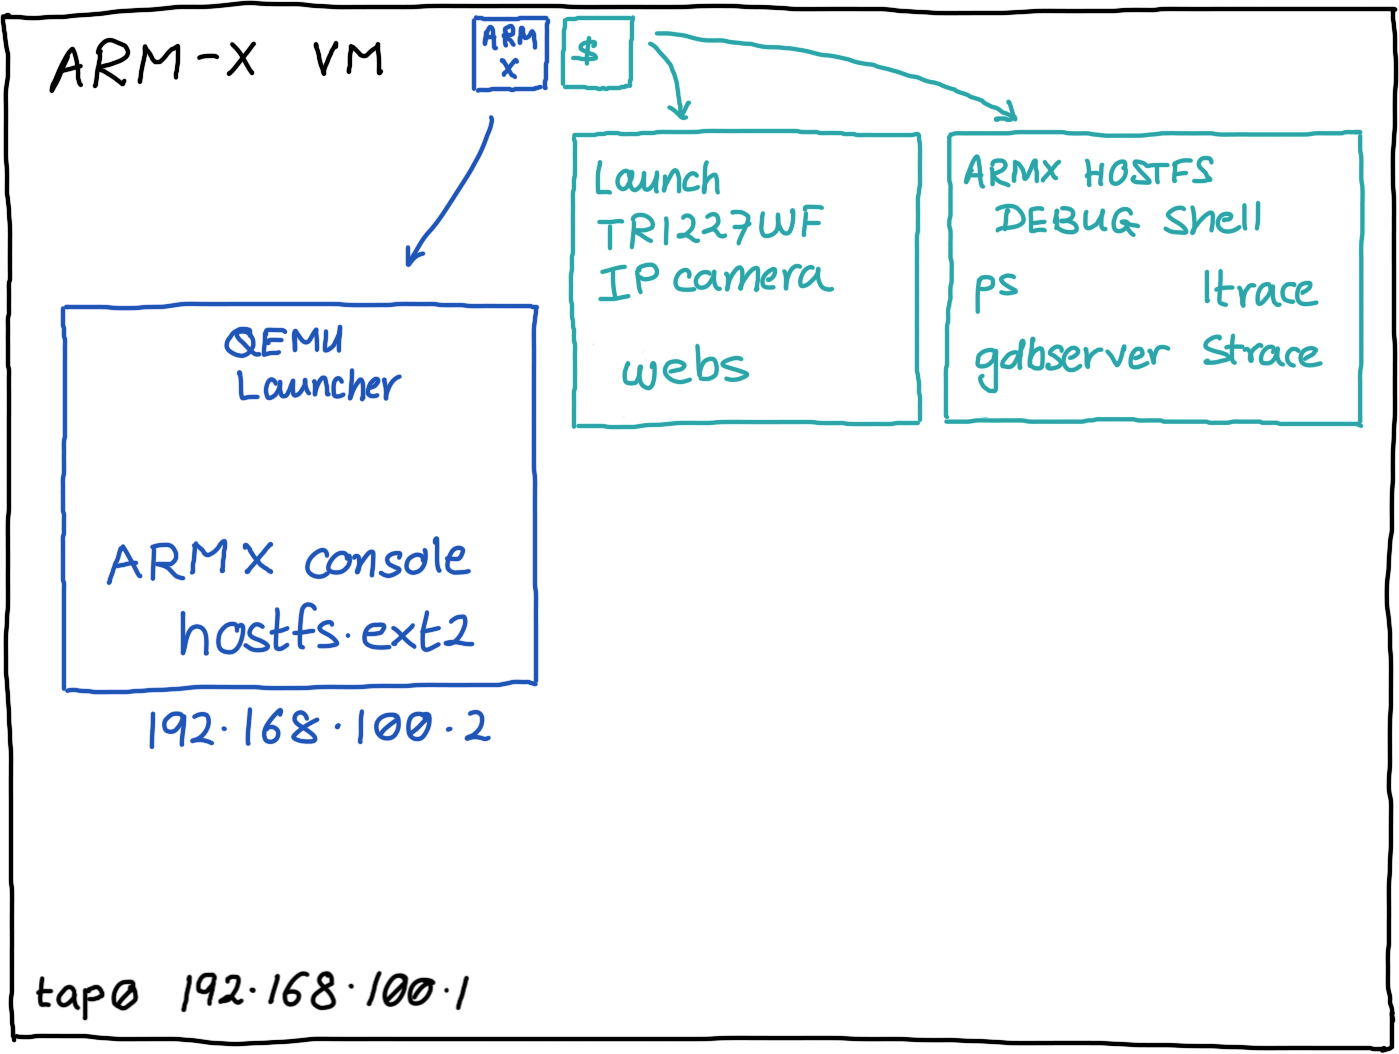
The ARM-X launcher invokes QEMU and boots the kernel registered with the IP Camera, mounts hostfs.ext2 and shows the ARM-X console.
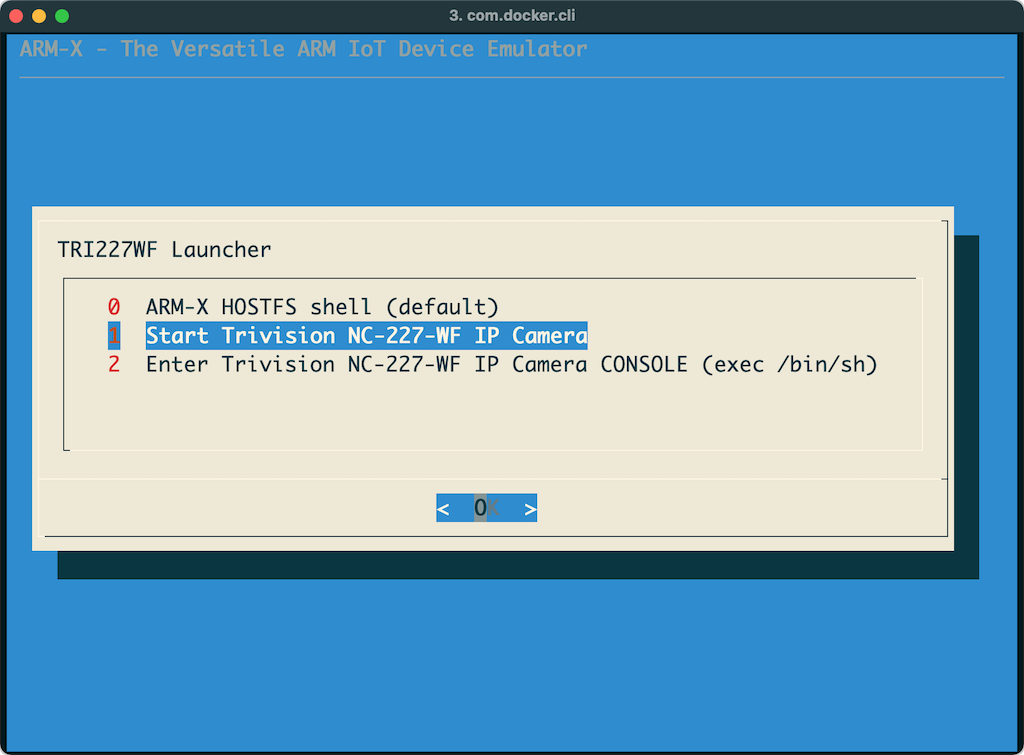
Click on the ARM-X Terminal icon next to the launcher icon on the top toolbar. Select the option Start Trivision NC-227-WF IP Camera.
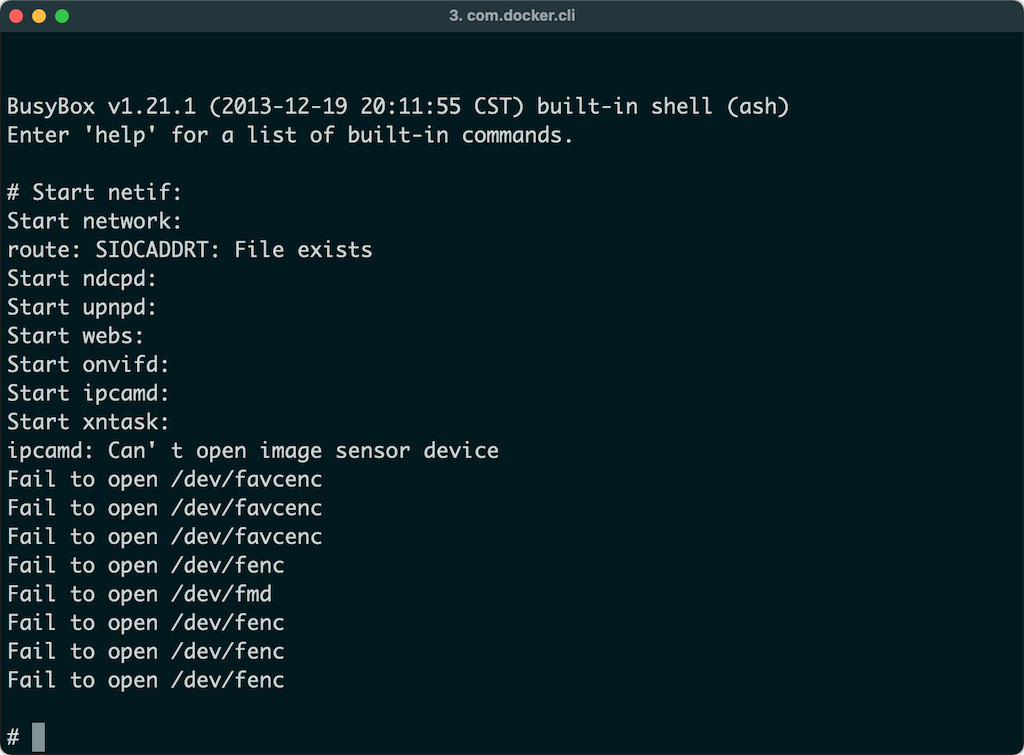
The IP Camera's init scripts will now be started and eventually all its system and application services will be running.
Clicking on the ARM-X Terminal icon again will invoke the ARM-X HOSTFS DEBUG Shell. This shell allows you to run commands to view running processes, inspect a process' virtual memory map, run utilities like objdump, strace, ltrace, etc.
At this point, the emulated IP Camera is ready to be analysed.
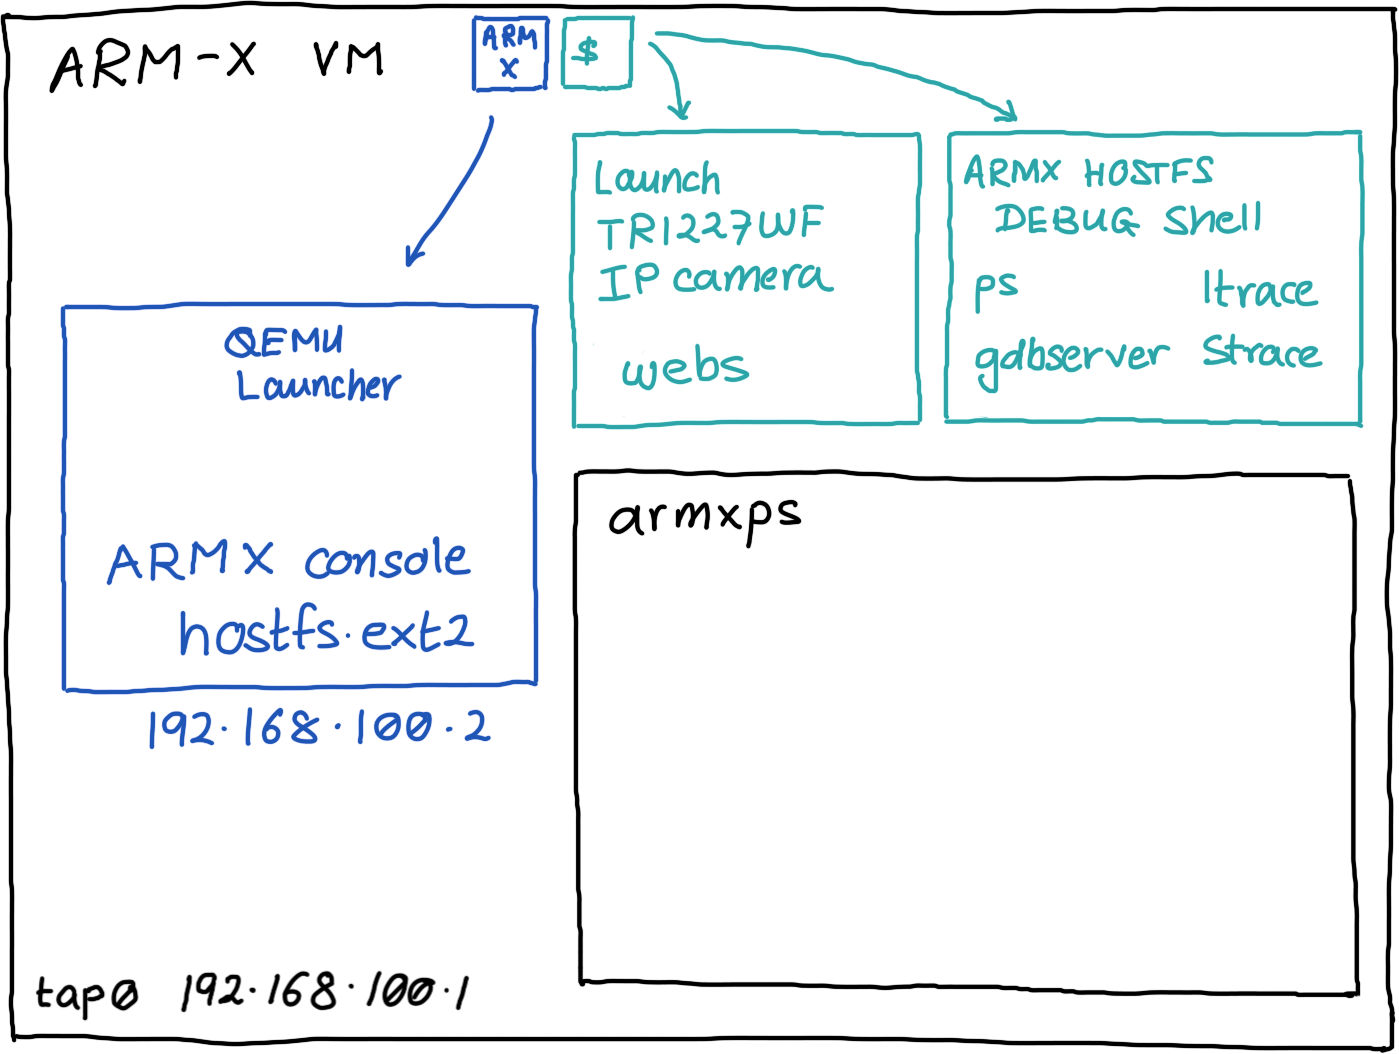
The /armx/run directory contains a few scripts to enable easy enumeration of the device's processes and also attach a debugger to a device process. /armx/run is present in the $PATH on the ARM-X VM.
Open a new terminal on the VM and run armxps:
armx~$ armxps
  PID TTY      STAT   TIME COMMAND
    1 ?        Ss     0:00 init
    2 ?        S<     0:00 [kthreadd]
    3 ?        S<     0:00 [ksoftirqd/0]
    4 ?        S<     0:00 [watchdog/0]
    5 ?        S<     0:00 [events/0]
    6 ?        S<     0:00 [khelper]
    9 ?        S<     0:00 [async/mgr]
  105 ?        S<     0:00 [kblockd/0]
  112 ?        S<     0:00 [kseriod]
  118 ?        S<     0:00 [kmmcd]
  143 ?        S      0:00 [khungtaskd]
  144 ?        S      0:00 [pdflush]
  145 ?        S      0:00 [pdflush]
  146 ?        S<     0:00 [kswapd0]
  147 ?        S<     0:00 [aio/0]
  148 ?        S<     0:00 [nfsiod]
  300 ?        S<     0:00 [scsi_eh_0]
  324 ?        S<     0:00 [mtdblockd]
  332 ?        S<     0:00 [kpsmoused]
  367 ?        S<     0:00 [rpciod/0]
  385 ?        Ss     0:00 /sbin/syslogd -m 0
  387 ?        Ss     0:00 /sbin/klogd
  409 ?        Ss     0:00 /usr/sbin/dropbear
  413 ttyAMA0  Ss+    0:00 /sbin/agetty -p -L ttyAMA0 115200 vt100
  414 ?        Ss     0:01 /usr/sbin/dropbear
  415 pts/0    Ss     0:00 -sh
  430 pts/0    S      0:00 /bin/bash ./run-init
  441 pts/0    S      0:00 /bin/sh /etc/armxinit
  465 ?        Ss     0:00 syslogd
  467 ?        Ss     0:00 klogd
  480 pts/0    S      0:00 nvctl
  482 pts/0    S      0:00 inetd_tcp
  493 pts/0    S      0:00 netmgr
  498 pts/0    S      0:00 storage
  501 pts/0    S      0:00 nvrd
  507 pts/0    S      0:00 httpclient -c /var/config/httpclient_task15.conf
  510 pts/0    S      0:00 taskmgr
  511 pts/0    S+     0:00 /bin/sh
  538 pts/0    S      0:00 ndcpd
  540 pts/0    S      0:00 ndcpd2
  542 pts/0    S      0:00 ndcpd3
  547 pts/0    S      0:00 upnpd eth0
  550 pts/0    S      0:00 upnpd eth0
  551 pts/0    S      0:00 upnpd eth0
  552 pts/0    S      0:00 upnpd eth0
  554 pts/0    S      0:00 upnpd eth0
  556 pts/0    S      0:00 webs
  557 pts/0    S      0:00 upnpd eth0
  559 pts/0    S      0:00 upnpd eth0
  560 pts/0    S      0:00 upnpd eth0
  562 pts/0    S      0:00 onvifn
  564 pts/0    S      0:00 onvifd
  567 pts/0    S      0:00 ipcamd
  569 pts/0    S      0:00 ipcamd
  571 pts/0    S      0:00 ipcamd
  572 ?        Ss     0:01 /usr/sbin/dropbear
  575 ?        R      0:00 ps ax
Internally, armxps invokes ssh and runs a process enumeration command on the emulated device accessible at 192.168.100.2. You can perform the same task by invoking the ARM-X HOSTFS Debug Shell and running the ps command within it, however armxps makes the task easier.
We will now invoke gdb and attach it to the webs process running in QEMU. We need a cross platform GDB that runs on an x86 host and is capable of debugging ARM targets. The ARM-X VM's host system has arm-linux-gnueabi-gdb installed in it.
The typical process would involve invoking the ARM-X HOSTFS Debug Shell, running gdbserver :5000 --attach $(pidof webs) and then invoking arm-linux-gnueabi-gdb and connecting to the remot target using:
target remote 192.168.100.2:5000
set sysroot target:/armx/TRI227WF/rootfs
The set sysroot command is important for GDB to find the proper binaries for symbol resolution, since the IP Camera's binaries are running inside a chroot jail.
However, all this is made easy using /armx/run/armxgdb. armxgdb launches arm-linux-gnueabi-gdb, and internally invokes ssh to launch gdbserver on 192.168.100.2. The remote debugging is enabled using STDIN to the SSH connection!

armx:~$ armxgdb webs
Remote debugging using | ssh -T root@192.168.100.2 gdbserver - --attach \`pidof webs\`
Attached; pid = 556
Remote debugging using stdio
Reading /armx/TRI227WF/rootfs/usr/bin/webs from remote target...
warning: File transfers from remote targets can be slow. Use "set sysroot" to access files locally instead.
Reading /armx/TRI227WF/rootfs/usr/bin/webs from remote target...
Reading symbols from target:/armx/TRI227WF/rootfs/usr/bin/webs...(no debugging symbols found)...done.
Reading /lib/libgcc_s.so.1 from remote target...
warning: .dynamic section for "target:/lib/libgcc_s.so.1" is not at the expected address (wrong library or version mismatch?)
Reading /lib/libc.so.0 from remote target...
warning: .dynamic section for "target:/lib/libc.so.0" is not at the expected address (wrong library or version mismatch?)
Reading /lib/ld-linux.so.3 from remote target...
Error while mapping shared library sections:
Could not open `target:/lib/ld-linux.so.3' as an executable file: No such file or directory
Reading symbols from target:/lib/libgcc_s.so.1...(no debugging symbols found)...done.
Reading symbols from target:/lib/libc.so.0...(no debugging symbols found)...done.
Reading /lib/ld-linux.so.3 from remote target...
warning: Unable to find dynamic linker breakpoint function.
GDB will be unable to debug shared library initializers
and track explicitly loaded dynamic code.
0x4002f8c4 in ?? () from target:/lib/libc.so.0
Reading /armx/TRI227WF/rootfs/lib/libgcc_s.so.1 from remote target...
Reading /armx/TRI227WF/rootfs/lib/libgcc_s.so.1 from remote target...
Reading symbols from target:/armx/TRI227WF/rootfs/lib/libgcc_s.so.1...done.
Reading /armx/TRI227WF/rootfs/lib/libc.so.0 from remote target...
Reading /armx/TRI227WF/rootfs/lib/libc.so.0 from remote target...
Reading symbols from target:/armx/TRI227WF/rootfs/lib/libc.so.0...done.
Reading /armx/TRI227WF/rootfs/lib/ld-linux.so.3 from remote target...
Reading /armx/TRI227WF/rootfs/lib/ld-linux.so.3 from remote target...
Reading symbols from target:/armx/TRI227WF/rootfs/lib/ld-linux.so.3...(no debugging symbols found)...done.
Reading /armx/TRI227WF/rootfs/lib/ld-linux.so.3 from remote target...
(gdb)
Now, you can go about debugging webs as you wish.
(gdb) info registers
r0             0xfffffdfe   4294966782
r1             0x40083c88   1074281608
r2             0x40083ca0   1074281632
r3             0x40083cb8   1074281656
r4             0xbefffa68   3204446824
r5             0x1  1
r6             0x40083ca0   1074281632
r7             0x8e 142
r8             0x40083cb8   1074281656
r9             0x4007a7a0   1074243488
r10            0x0  0
r11            0x4  4
r12            0x61068  397416
sp             0xbefffa38   0xbefffa38
lr             0x43cf0  277744
pc             0x4002f8c4   0x4002f8c4 <select+16>
cpsr           0x60000010   1610612752
(gdb) info proc mappings
process 556
Mapped address spaces:

    Start Addr   End Addr       Size     Offset objfile
        0x8000    0x59000    0x51000        0x0 /armx/TRI227WF/rootfs/usr/bin/webs
       0x60000    0x61000     0x1000    0x50000 /armx/TRI227WF/rootfs/usr/bin/webs
       0x61000    0x65000     0x4000    0x51000 /armx/TRI227WF/rootfs/usr/bin/webs
       0x65000    0x78000    0x13000        0x0 [heap]
    0x40000000 0x40005000     0x5000        0x0 /armx/TRI227WF/rootfs/lib/ld-uClibc-0.9.30.2.so
    0x40005000 0x40006000     0x1000        0x0
    0x4000c000 0x4000d000     0x1000     0x4000 /armx/TRI227WF/rootfs/lib/ld-uClibc-0.9.30.2.so
    0x4000d000 0x4000e000     0x1000     0x5000 /armx/TRI227WF/rootfs/lib/ld-uClibc-0.9.30.2.so
    0x4000e000 0x40018000     0xa000        0x0 /armx/TRI227WF/rootfs/lib/libgcc_s.so.1
    0x40018000 0x4001f000     0x7000        0x0
    0x4001f000 0x40020000     0x1000     0x9000 /armx/TRI227WF/rootfs/lib/libgcc_s.so.1
    0x40020000 0x40021000     0x1000     0xa000 /armx/TRI227WF/rootfs/lib/libgcc_s.so.1
    0x40021000 0x4006b000    0x4a000        0x0 /armx/TRI227WF/rootfs/lib/libuClibc-0.9.30.2.so
    0x4006b000 0x40072000     0x7000        0x0
    0x40072000 0x40073000     0x1000    0x49000 /armx/TRI227WF/rootfs/lib/libuClibc-0.9.30.2.so
    0x40073000 0x40074000     0x1000    0x4a000 /armx/TRI227WF/rootfs/lib/libuClibc-0.9.30.2.so
    0x40074000 0x400f9000    0x85000        0x0
    0xbefeb000 0xbf000000    0x15000        0x0 [stack]
ARM-X Home Page: https://armx.exploitlab.net/
VMWare VM: https://app.box.com/s/3iyi5f6vpakngh8ti3ir2zzukgdu0j2q